Traditional Business Rules vs. Predictive Software Features
I spent nearly half of my career writing requirements and developing and testing software the traditional way....
|
CONSTRUCTION & REAL ESTATE
|
 |
|
Discover how crafting a robust AI data strategy identifies high-value opportunities. Learn how Ryan Companies used AI to enhance efficiency and innovation.
|
| Read the Case Study ⇢ |
|
LEGAL SERVICES
|
 |
|
Discover how a global law firm uses intelligent automation to enhance client services. Learn how AI improves efficiency, document processing, and client satisfaction.
|
| Read the Case Study ⇢ |
|
HEALTHCARE
|
 |
|
A startup in digital health trained a risk model to open up a robust, precise, and scalable processing pipeline so providers could move faster, and patients could move with confidence after spinal surgery.
|
| Read the Case Study ⇢ |
|
LEGAL SERVICES
|
 |
|
Learn how Synaptiq helped a law firm cut down on administrative hours during a document migration project.
|
| Read the Case Study ⇢ |
|
GOVERNMENT/LEGAL SERVICES
|
 |
|
Learn how Synaptiq helped a government law firm build an AI product to streamline client experiences.
|
| Read the Case Study ⇢ |
 |
|
Mushrooms, Goats, and Machine Learning: What do they all have in common? You may never know unless you get started exploring the fundamentals of Machine Learning with Dr. Tim Oates, Synaptiq's Chief Data Scientist. You can read and visualize his new book in Python, tinker with inputs, and practice machine learning techniques for free. |
| Start Chapter 1 Now ⇢ |
By: Lauren Haines 1 Nov 30, 2023 10:41:17 AM

In the e-commerce marketplace, the ability to analyze and act upon data marks the distinction between leading and lagging. Every interaction — be it a click, purchase, review, or even an abandoned cart — tells a story. Interpreted in aggregate, these data points become data-driven stories that can offer valuable insights into customer habits, market trends, and other strategic considerations for e-commerce businesses.
Linear regression is a fundamental technique for interpreting and extracting insights from data. Let’s explore how e-commerce businesses can employ linear regression to transform their data into a strategic asset with a practical business case: predicting future sales volume based on past website traffic.
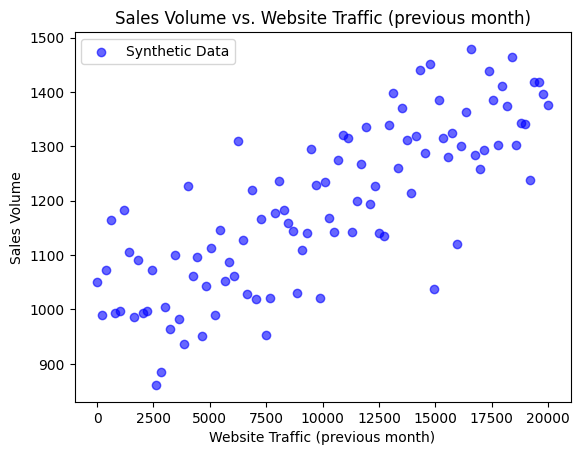
We generated synthetic data to simulate real sales volume and website traffic data. Each point on the scatter plot below represents one month of sales volume and website traffic for a fictitious e-commerce business, “Shoplr.” The x-axis, Sales Volume, represents the number of products Shoplr sold during a given month, and the y-axis, Website Traffic (previous month), represents the number of visitors to Shoplr’s online storefront during the previous month.

We can see that points on the right side of the x-axis tend to be high on the y-axis, and points on the left side of the x-axis tend to be low on the y-axis. This pattern suggests a positive linear relationship, where an increase in website traffic in one month usually means an increase in sales volume the next month.
We can use linear regression to construct a statistical model quantifying this relationship. The model will use past website traffic data to forecast future sales volumes, enabling Shoplr to predict with a reasonable degree of accuracy what sales volume will look like next month based on website traffic this month.
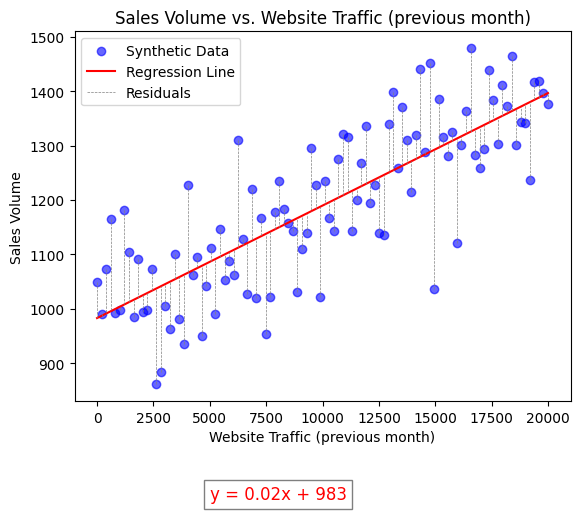
We performed linear regression to model the relationship between sales volume and website traffic as a linear equation. This equation represents a “best-fit” line that minimizes the sum of the squared differences (residuals) between the observed values of sales volume and the values predicted by the line.
The slope of our best-fit line is 0.02, and the y-intercept is 983. Thus, we predict that sales volume will be 983 units when website traffic is zero and increase by 0.02 units for each additional unit of website traffic.

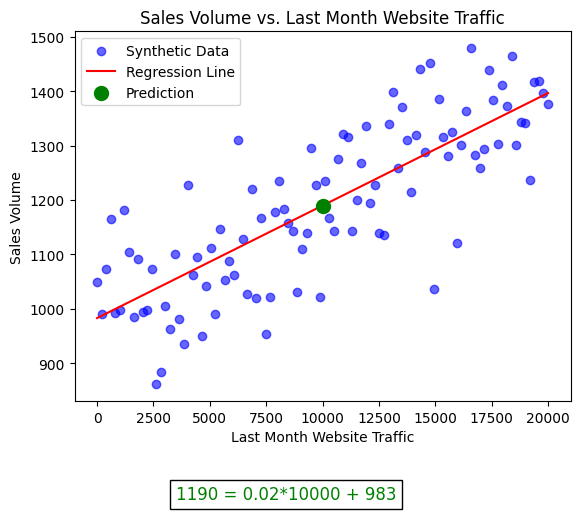
We can plug any actual or projected website traffic value into our linear regression model to forecast future sales volumes. For example, if Shoplr counted 10,000 visitors to its online storefront in November 2023, we should be able to plug that value into our model to forecast its sales volume in December 2023 with reasonable accuracy.
To make this prediction, we multiply our slope (0.02) by website traffic in November 2023 (10,000) and add the product to our y-intercept (983) to get 1190. Thus, we predict that sales volume will be 1190 in December 2023.

The ability to forecast future sales volume gives Shoplr a significant strategic advantage. This capability allows for more informed decision-making in areas such as inventory management, marketing strategy, resource allocation, and overall business planning. With predictive insights into sales trends, Shoplr can optimize operations, reduce costs, anticipate customer demand, and stay a step ahead of its less innovative and data-savvy competitors.
In a dynamic and data-driven e-commerce market, foregoing tools like linear regression is like sailing without a compass. The utility of statistical methods for strategic decision-making cannot be overstated. As this business case with Shoplr demonstrates, linear regression offers a straightforward yet powerful means to transform raw data into actionable insights that provide a competitive edge in an increasingly crowded digital marketplace.

Photo by Synaptiq
Synaptiq is an AI and data science consultancy based in Portland, Oregon. We collaborate with our clients to develop human-centered products and solutions. We uphold a strong commitment to ethics and innovation.
Contact us if you have a problem to solve, a process to refine, or a question to ask.
You can learn more about our story through our past projects, our blog, or our podcast.
I spent nearly half of my career writing requirements and developing and testing software the traditional way....
April 8, 2025
If you don’t take a TOP DOWN and BOTTOM UP approach to design user-facing AI software, you’ll suffer the consequences...
April 8, 2025
I regularly meet executives that are pondering what to do with AI.
Typical responses I hear are:
“Clearly it’s...
April 8, 2025