

Why AI Projects Fail and How to Get Them Right
AI has never been more accessible. In just the past few years, organizations have gone from experimenting with machine...


|
AI & DATA STRATEGY
|
 |
|
Synaptiq helps you develop your AI and data strategy as well as accelerate your roadmap to achieve successful business outcomes. Assess your AI and data readiness so you can prioritize the gaps you need to fill.
|
| Read More ⇢ |
|
DATA LAKE
|
 |
|
Synaptiq helps you unify structured and unstructured data into a secure, compliant data lake that powers AI, advanced analytics and real-time decision-making across your business.
|
| Read More ⇢ |
|
AI AGENTS & CHATBOTS
|
 |
|
Synaptiq helps you create AI agents and chatbots that leverage your proprietary data to automate tasks, improve efficiency, and deliver reliable answers within your workflows.
|
| Read More ⇢ |
|
LEGAL SERVICES
|
 |
|
Learn how Synaptiq helped a law firm cut down on administrative hours during a document migration project.
|
| Read the Case Study ⇢ |
|
GOVERNMENT/LEGAL SERVICES
|
 |
|
Learn how Synaptiq helped a government law firm build an AI product to streamline client experiences.
|
| Read the Case Study ⇢ |
 |
|
Mushrooms, Goats, and Machine Learning: What do they all have in common? You may never know unless you get started exploring the fundamentals of Machine Learning with Dr. Tim Oates, Synaptiq's Chief Data Scientist. You can read and visualize his new book in Python, tinker with inputs, and practice machine learning techniques for free. |
| Start Chapter 1 Now ⇢ |


Understanding the factors influencing compensation is essential in the tech industry, where talent drives innovation. For web developers, experience is often a key determinant of salary. In this blog, we use a technique called linear regression to model the relationship between experience and salary, providing valuable insights for employees and employers.
Our analysis focuses on a simulated dataset from Kaggle, an online data science and machine learning community. The dataset includes information about IT professionals, such as gender, years of experience, job position, and salary. We’ll use it to investigate the relationship between experience and salary, specifically for web developers.
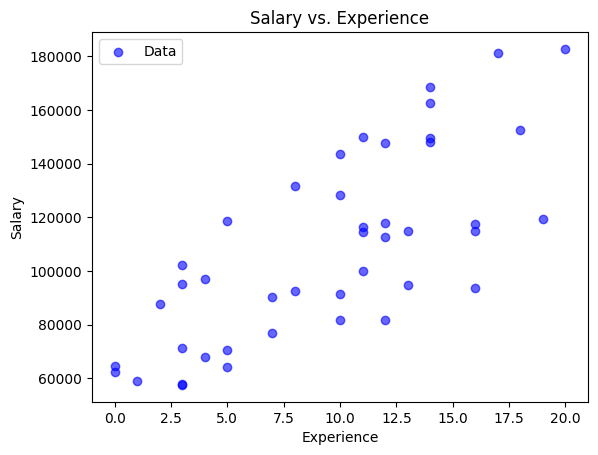
The data points on the scatter plot below represent the web developers in our dataset. Each point represents one web developer. The x-axis (`Experience`) represents their years of work experience. The y-axis (`Salary`) represents their annual salary.
As the x-values (`Experience`) increase, the y-values (`Salary`) also tend to increase, indicating a positive linear relationship between the two variables. In other words, each additional year of experience correlates with a salary increase. But what is the exact impact of each additional year of experience on salary?
We can use linear regression to answer that question.
Backstage, we ran a simple Python script to perform linear regression, which gave us a fitted linear equation that models the relationship between experience and salary: `y = 4766.5448x + 63122.22`
`y` represents salary.
`x` represents experience.
`4766.5448` represents the change in salary for a one-year change in experience.
`63122.22` represents the value of salary when experience is zero.
We can input any experience value `x` into our salary equation to predict the corresponding salary `y`. The red line on the scatter plot below visualizes these predictions, but there’s a catch. While the line captures the overall trend in the data, it cannot precisely predict the exact value of each data point. The dotted lines on the scatter plot represent the gaps between the observed and predicted value of salary `y` for each observed value of experience `x`. For instance, the rightmost dotted line highlights the difference between the observed and predicted salary of a developer with 20 years of experience.
These gaps, called residuals, represent the influence of factors other than experience `x` on salary `y`. Residuals occur because modeling a complex real-world relationship with a simple equation means sacrificing some accuracy for the sake of simplicity. Large residuals suggest that, although our equation can provide a ballpark estimate of salary based on experience, it can’t explain much of the variation in salary. Therefore, we must remember that our predictions are estimates, not certainties.
We can predict salary based on experience by inputting a value for experience `x` into our equation and solving for salary `y`. For instance, if we want to predict the salary of a web developer with 12 years of experience, we substitute 12 for `x` and solve for `y`.
`y = 4766.5448x + 63122.22`
`y = 4766.5448(12) + 63122.22`
`y =120,320.7576`
We thus find that the predicted salary for a web developer with 12 years of experience is about $120,321. The green point on the scatter plot below represents this prediction. (The size of the dot is arbitrary; we made it larger than the blue dots representing our observed data so that it would be easy to see.)
Due to the limitations of our model, its predictions should not be the sole input for real-world decisions. However, it can be used alongside other inputs to support and inform career planning, salary negotiations, and other decision-making tasks that benefit from insights into the relationship between salary and experience.
Linear regression provides a simple yet effective approach for understanding the relationship between experience and salary for web developersWith this information, web developers can make more informed career decisions, and employers can design competitive compensation packages that attract and retain top talent. In the fast-paced tech industry, data-driven insights like these are invaluable for staying ahead of the curve.

Photo by Ricardo Gomez Angel on Unsplash
Synaptiq is an AI and data science consultancy based in Portland, Oregon. We collaborate with our clients to develop human-centered products and solutions. We uphold a strong commitment to ethics and innovation.
Contact us if you have a problem to solve, a process to refine, or a question to ask.
You can learn more about our story through our past projects, our blog, or our podcast.